
Work · Selected cases
From problemsto outcomes.
Start by understanding how people work, where systems fail, and what the evidence shows. Define the problem, make the right change, and leave the organization able to keep improving.
Selected work led by UX Design Lab founder Pavel Bukengolts across consulting engagements and enterprise design leadership roles. Client identities and proprietary details are omitted where required.
One model.Different interventions.
Each engagement follows the same operating model. Evidence establishes the current state, alignment defines the real problem, implementation changes the right part of the system, and iteration transfers the capability to continue improving it.
Assess
Find the actual condition
Research identifies the users, workflows, systems, constraints, risks, and evidence shaping the current state.
Outcome
Evidence over assumptions.
Align
Establish shared understanding
Evidence is translated into service blueprints, journey maps, system models, prototypes, priorities, and measurable success criteria.
Outcome
One problem. Shared decisions.
Implement
Change the right system
The intervention may be a product, workflow, information architecture, design system, accessibility program, AI knowledge layer, governance model, or operational change.
Outcome
Change at the source.
Iterate
Transfer ownership, keep improving
Documentation, governance, measurement, training, feedback loops, and internal ownership allow the system to continue improving after implementation.
Outcome
Capability, not dependency.
↻ Iteration feeds the next assessment
Different problems.Same discipline.
Six business problems. Six different interventions. The work spans ethnographic research, service design, AI governance, accessibility, DesignOps, enterprise design systems, and organizational change. Each case shows the initial condition, evidence, intervention, and measurable result.
Eleven systems. One operation.
MARITIME LOGISTICS
35%FASTER CRITICAL WORKFLOWS
AI PRODUCT DESIGN
1GOVERNED LAYER FOR MULTIPLE APPROVED AI WORKFLOWS
Design systems at enterprise scale.
GLOBAL ENTERPRISE
40%FASTER PRODUCTION
SERVICE DESIGN
93%OF IDENTIFIED ISSUES WERE NON-TECHNICAL
Accessibility built into delivery.
GLOBAL ENTERPRISE
18%FEWER ACCESSIBILITY DEFECTS
Unifying 70+ digital properties.
INSURANCE
20%LOWER DEPARTMENTAL COST
MARITIME LOGISTICS · PRODUCT STRATEGY
Eleven systems. One operation.
Initial state
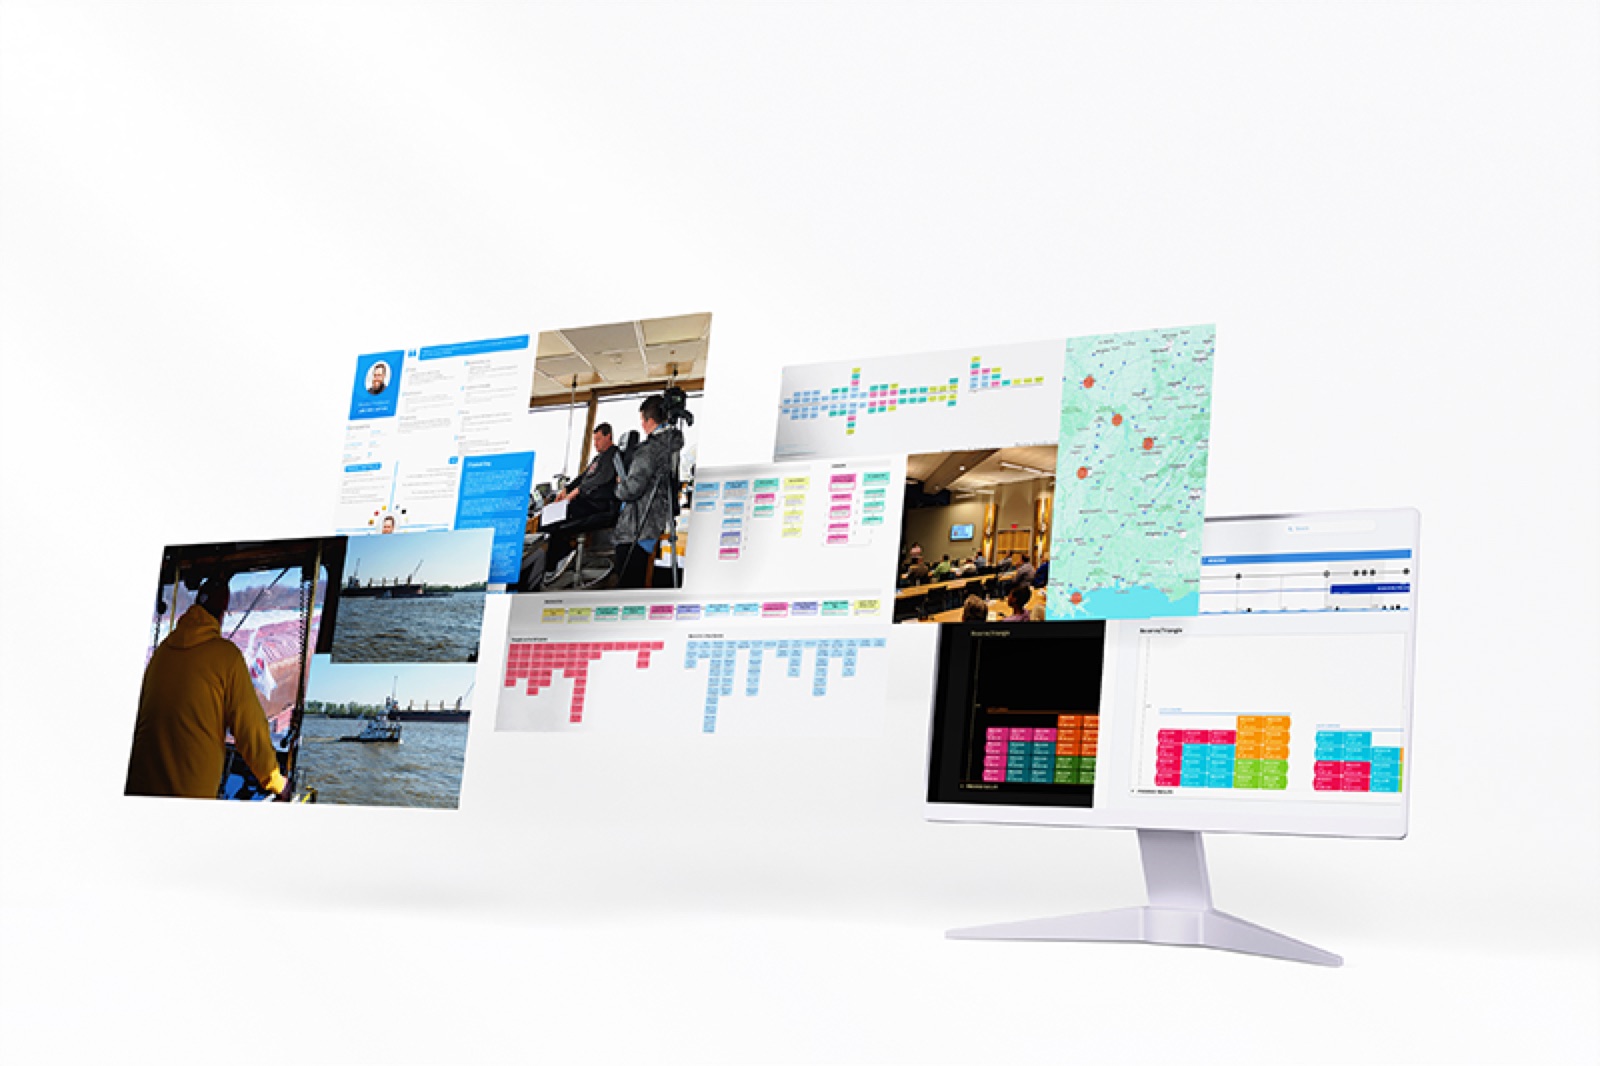
Critical fleet operations depended on 11 disconnected legacy systems, spreadsheets, email, phone, and radio. Captains, dispatchers, maintenance teams, and business units worked from different information. The core problem was not system integration. It was the absence of a shared operational picture.
Capabilities applied
- UX strategy
- Ethnographic research
- Contextual inquiry
- Service design
- Journey mapping
- Workflow design
- Product design
- Usability testing
Initial assumption
Connect eleven applications.
→ Evidence
Operational roles lacked one reliable fleet picture.
→ Reframed problem
Create one shared operational view.
01 · ASSESS
Field research exposed workflow gaps
A 101-day research program followed work across vessels, dispatch centers, repair facilities, and business operations. Contextual inquiry and ethnographic research exposed workarounds, broken handoffs, and information gaps absent from requirements documentation.
METHODS
Contextual inquiry · Ethnographic field research · Interviews · Journey mapping · Day-in-the-life research · 11 roles
02 · ALIGN
Operations replaced integration
Research identified the Linehaul Captain as a critical decision point and established a shared workflow model for product, engineering, and operations.
METHODS
Stakeholder workshops · Workflow architecture · Persona prioritization · Jobs to Be Done · Product strategy
03 · IMPLEMENT
Workflows drove product design
A unified, role-aware Fleet Picture introduced shared fleet-state visibility, what-if planning, offline support, low-light use, and governed write access.
METHODS
Information architecture · Prototyping · Role-based workflows · Usability validation · Design system
04 · ITERATE
Research became internal practice
Operator feedback and design-to-engineering validation continued through delivery. The research-led product process became an internal standard for future work.
CAPABILITY LEFT BEHIND
Research practice · Shared product model · Design system · Decision rules · Research-to-release continuity
What changed
- 35%
- FASTER CRITICAL WORKFLOWS
- 21%
- FEWER COMMUNICATION-RELATED ERRORS
- 11 → 1
- LEGACY SYSTEMS → ONE PLATFORM
Business pattern
Fragmented systems often create operational problems that integration alone cannot solve.
AI PRODUCT DESIGN · KNOWLEDGE GOVERNANCE
Governed knowledge for AI.
Initial state
Policies, research, procedures, project decisions, and domain knowledge were distributed across disconnected systems. Employees needed to know the right person, folder, or search term. Early AI experiments produced fluent answers without reliably exposing stale, conflicting, or inaccessible source information.
Capabilities applied
- AI product strategy
- User research
- Information architecture
- Knowledge architecture
- AI interaction design
- AI governance
- MCP
- AI evaluation
Initial assumption
Connect more company data.
→ Evidence
Connected answers were not necessarily trusted answers.
→ Reframed problem
Make evidence visible and governed.
01 · ASSESS
Knowledge flows were mapped
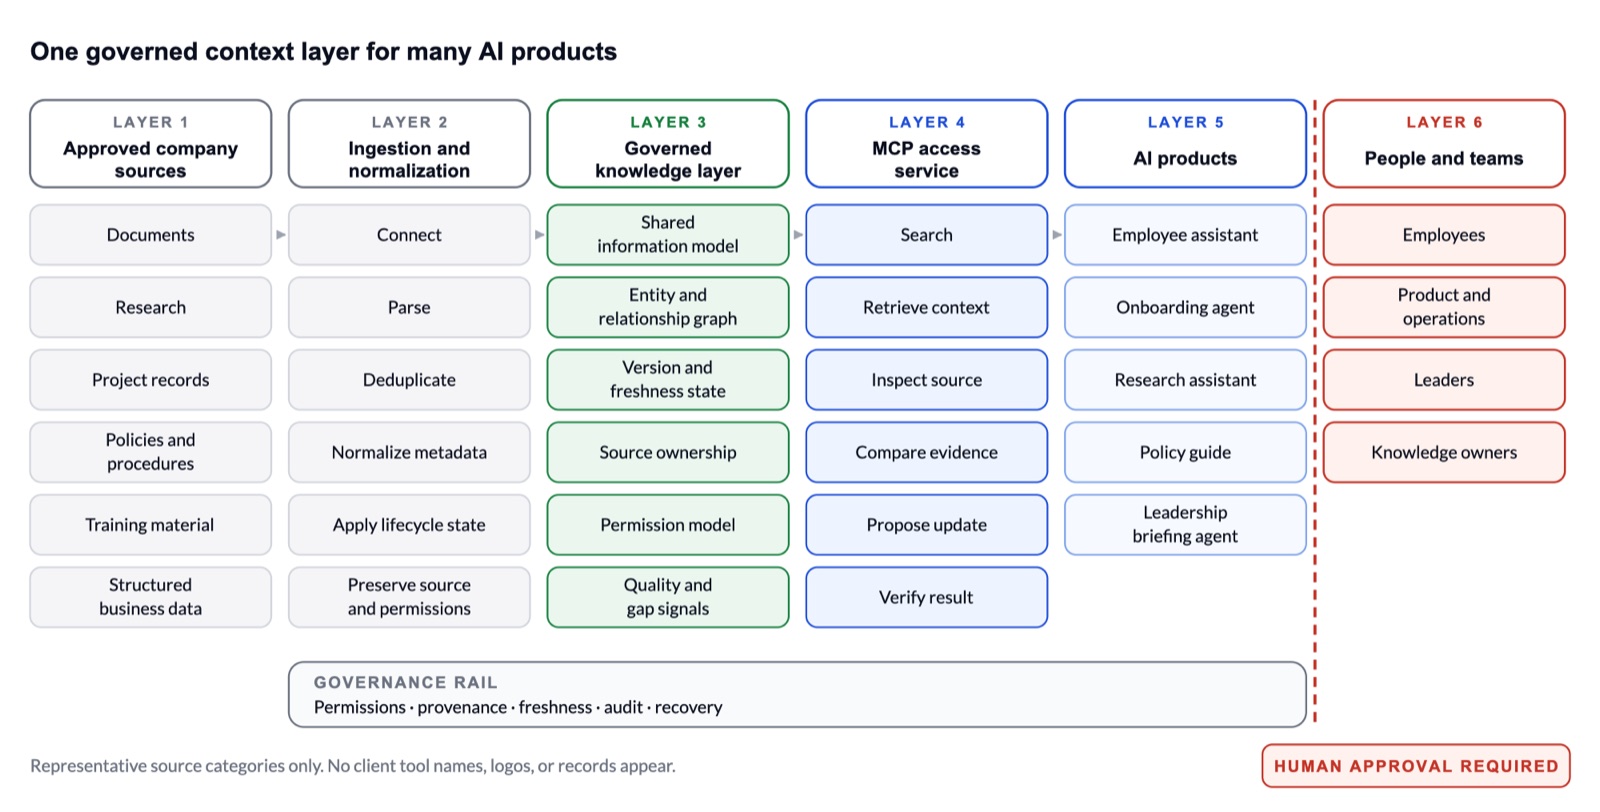
The assessment mapped information sources, search behavior, ownership, permissions, freshness, and retrieval patterns to identify the conditions required for trustworthy AI answers.
METHODS
Stakeholder research · Information-flow mapping · Source inventory · Permission analysis · Usability research
02 · ALIGN
Trust became a requirement
The product model defined explicit requirements for provenance, ownership, permissions, freshness, conflicting sources, recovery, and human responsibility.
METHODS
Evidence contract · AI state modeling · Governance workshops · Human–AI responsibility mapping
03 · IMPLEMENT
One governed knowledge layer
A shared information model exposed ownership, version state, permissions, quality signals, evidence, and recovery paths through reusable MCP access. Consequential actions stopped at a human approval boundary.
METHODS
AI product architecture · MCP · Permission-aware retrieval · Provenance · Human-in-the-loop · Failure and recovery design
04 · ITERATE
Corrections improved the system
Corrections, stale content, conflicts, and unanswered questions became quality signals. Evaluation criteria, source ownership, and governance workflows supported continued improvement.
CAPABILITY LEFT BEHIND
Evaluation criteria · Source ownership · Governance loop · Knowledge-gap workflow · Reusable MCP foundation
What changed
- 1
- GOVERNED LAYER FOR MULTIPLE APPROVED AI WORKFLOWS
- PILOT
- LIMITED PILOT VALIDATED THE CORE MODEL
- REUSABLE
- EVIDENCE + PERMISSIONS, NOT REBUILT PER ASSISTANT
Business pattern
AI becomes a governance problem when answers move faster than evidence, ownership, and accountability.
GLOBAL ENTERPRISE · DESIGN SYSTEMS
Design systems at enterprise scale.
Initial state
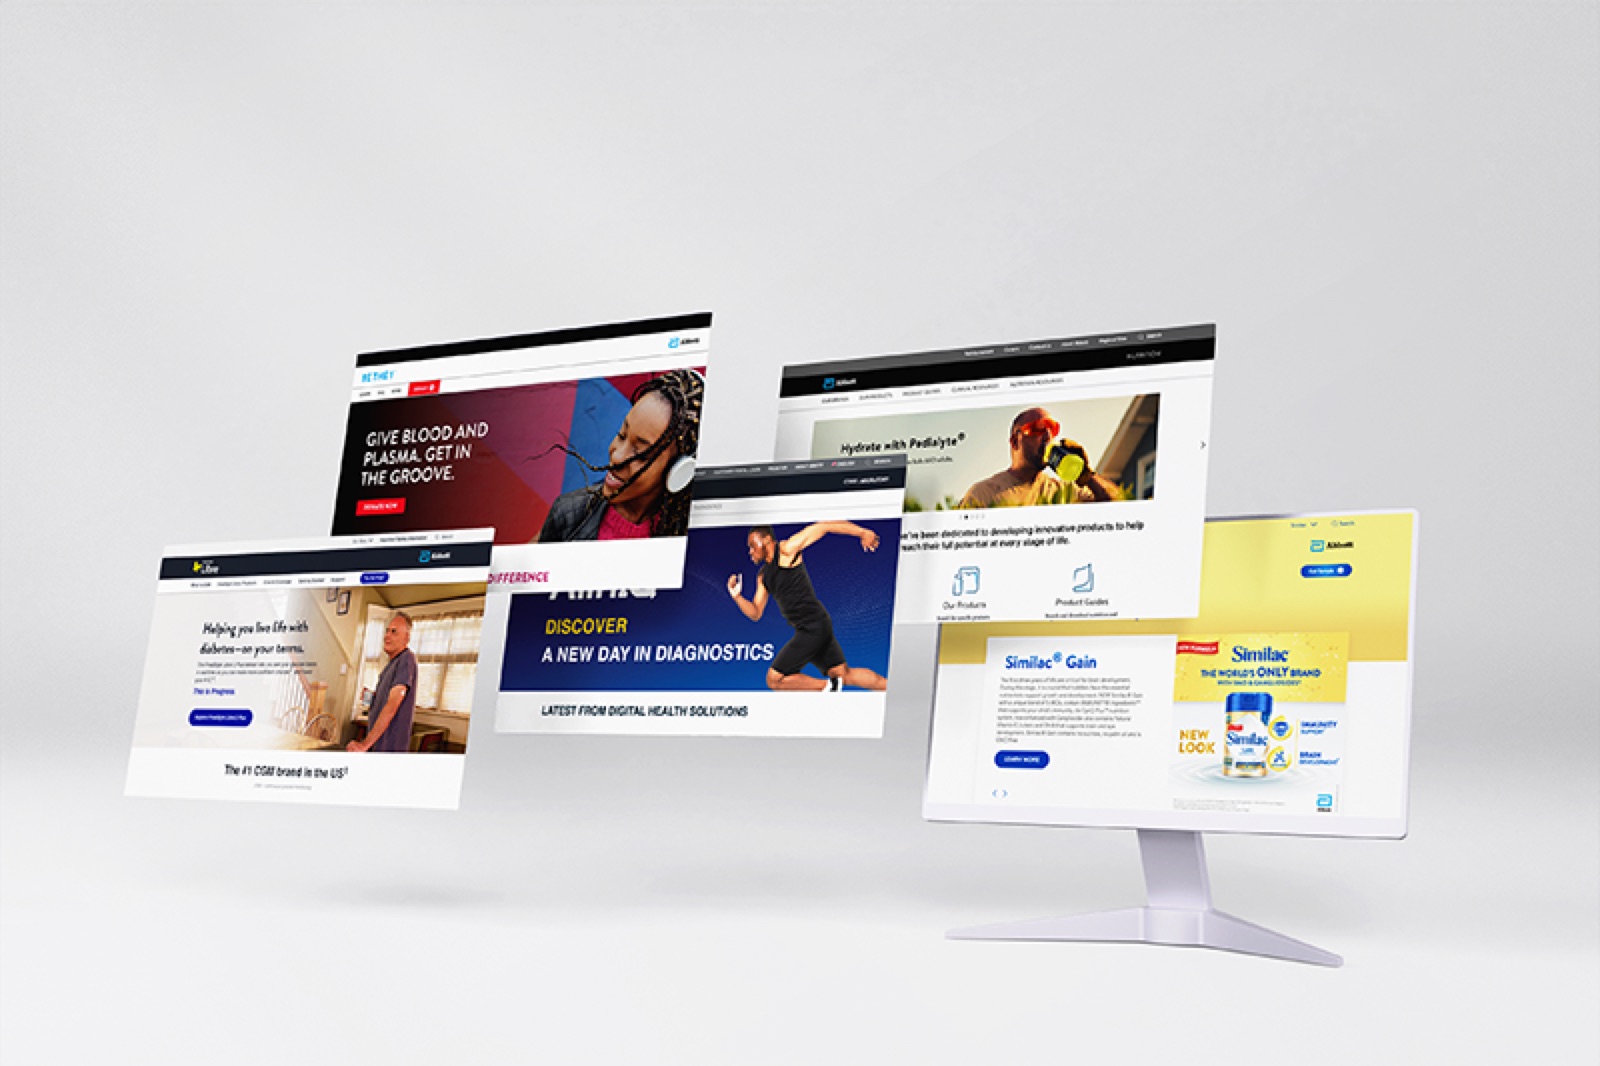
Hundreds of digital properties were delivered across regions, internal teams, and vendors. Similar solutions were repeatedly redesigned and rebuilt, while accessibility, quality, and delivery practices varied across the enterprise.
Capabilities applied
- Enterprise design systems
- DesignOps
- Figma migration
- Component architecture
- AEM
- Accessibility
- Governance
- Vendor enablement
Initial assumption
Standardize shared components.
→ Evidence
A ~50-site pilot cut delivery cost by more than 50%.
→ Reframed problem
Standardize enterprise digital delivery.
01 · ASSESS
One division proved the model
Discovery identified recurring patterns, component needs, workflow friction, and accessibility requirements. A divisional V1 established the first reusable system.
METHODS
Design-system discovery · Component audit · Workflow analysis · Design principles · Pilot architecture
02 · ALIGN
Pilot results justified scale
APAC pilot results shifted the business case from visual consistency to delivery economics and enterprise-wide operating efficiency.
METHODS
Pilot program · ROI evidence · Executive alignment · Governance model · Adoption strategy
03 · IMPLEMENT
Library became delivery infrastructure
Figma, Storybook principles, Adobe Experience Manager, reusable templates, cross-brand theming, vendor onboarding, accessibility reviews, and governance were connected into one delivery model.
METHODS
Figma · Storybook · Adobe Experience Manager · Cross-brand theming · WCAG 2.2 gates
04 · ITERATE
Governance sustained the system
Contribution rules, documentation, onboarding, design reviews, accessibility standards, and regular updates allowed internal teams and vendors to evolve the system without returning to one-off work.
CAPABILITY LEFT BEHIND
Governance · Contribution model · Vendor onboarding · Documentation · Reusable architecture · Accessibility standards
What changed
- 40%
- FASTER PRODUCTION
- 50%+
- LOWER DELIVERY COSTS
- 18%
- FEWER ACCESSIBILITY DEFECTS
- 800+
- DIGITAL PROPERTIES SUPPORTED
Business pattern
Design systems fail when the library exists but governance, adoption, and delivery practices do not.
SERVICE DESIGN · PRODUCT DE-RISKING
De-risking a $900K build.
Initial state
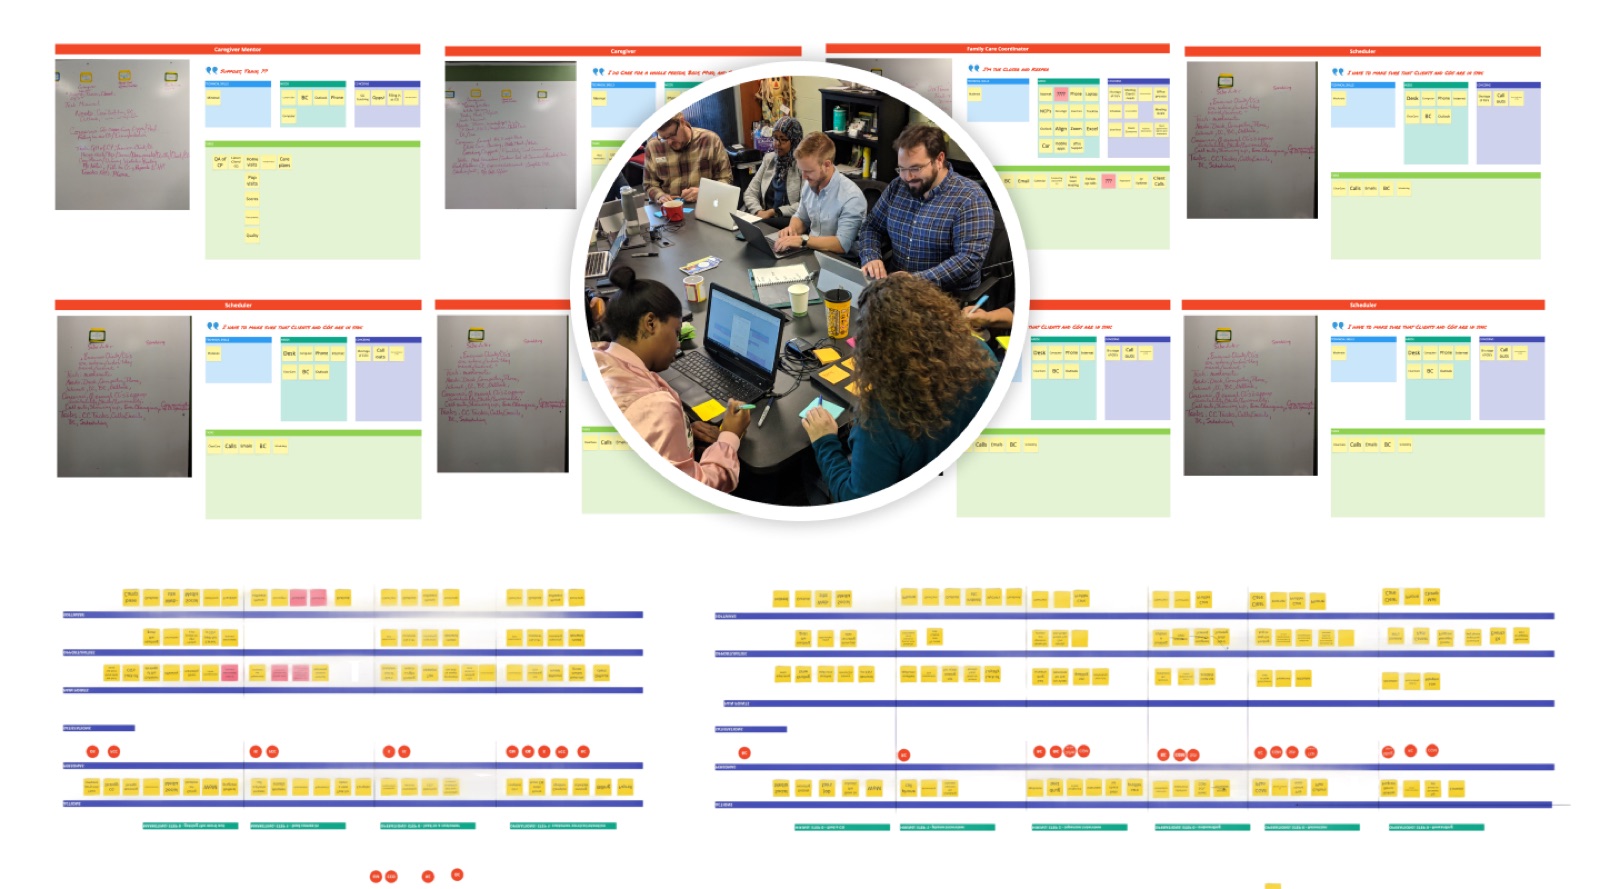
A growing caregiving business faced staff overload, duplicate data entry, scheduling failures, and broken communication across disconnected systems. A custom bridge application was already being considered. A two-week service-design diagnostic tested whether software addressed the underlying problem.
Capabilities applied
- Service design
- Service blueprinting
- Discovery workshops
- Workflow mapping
- Journey mapping
- Jobs to Be Done
- Product de-risking
- Operational strategy
Initial assumption
Build software connecting the systems.
→ Evidence
42 of 45 pain points were process-based.
→ Reframed problem
Redesign workflows and handoffs.
01 · ASSESS
Service blueprint exposed failures
Discovery workshops mapped core workflows, dependencies, ten staff personas, Jobs to Be Done, and pain points. The resulting service blueprint showed where the service actually broke down.
METHODS
Service design workshop · Service blueprint · Workflow mapping · Personas · JTBD · Pain-point analysis
02 · ALIGN
One diagnosis replaced assumptions
The service blueprint became the shared reference point. Information previously held across individual roles and workarounds became visible in one operational model.
METHODS
Facilitation · Journey mapping · Service blueprinting · Stakeholder alignment · Problem reframing
03 · IMPLEMENT
Software build was stopped
The proposed software project was stopped. An operational roadmap addressed handoffs, intake, single-entry workflows, existing tools, operational metrics, and targeted process improvements.
METHODS
Operational roadmap · Workflow redesign · Process improvement · Existing-tool optimization · Prioritization
04 · ITERATE
The method stayed behind
The client team participated in mapping the operation, identifying failures, and defining recommendations. The service-design process became an internal framework for future problem solving.
CAPABILITY LEFT BEHIND
Service-design framework · Operational ownership · Shared artifacts · Facilitation model · Continuous improvement
What changed
- 93%
- OF IDENTIFIED ISSUES WERE NON-TECHNICAL
- $900K+
- UNNECESSARY SOFTWARE INVESTMENT AVOIDED
- 2 WEEKS
- FROM BRIEF TO SHARED DIAGNOSIS
Business pattern
Large software investments carry unnecessary risk when the underlying service has never been mapped.
GLOBAL ENTERPRISE · ACCESSIBILITY
Accessibility built into delivery.
Initial state
Accessibility activity existed across multiple regions, but practices were fragmented. Education, audits, and advocacy did not prevent recurring defects from reaching late stages of delivery. The gap was operational enforcement.
Capabilities applied
- Accessibility strategy
- WCAG 2.2
- Accessibility governance
- VPAT
- Procurement
- Vendor governance
- Power BI
- Shift-left accessibility
Initial assumption
Increase accessibility awareness.
→ Evidence
Education could not override delivery pressure.
→ Reframed problem
Embed accessibility into delivery.
01 · ASSESS
Delivery gaps were identified
Accessibility was traced through design, development, procurement, vendors, review, and release. The assessment exposed the gap between accessibility knowledge and required delivery behavior.
METHODS
Accessibility maturity assessment · Systems mapping · Stakeholder analysis · Workflow review · Governance analysis
02 · ALIGN
Accessibility became operational risk
Legal, Regulatory, and Procurement aligned accessibility with risk reduction, vendor quality, and predictable delivery.
METHODS
Executive alignment · Cross-functional coalition · Risk framing · Governance design
03 · IMPLEMENT
Accessibility entered the workflow
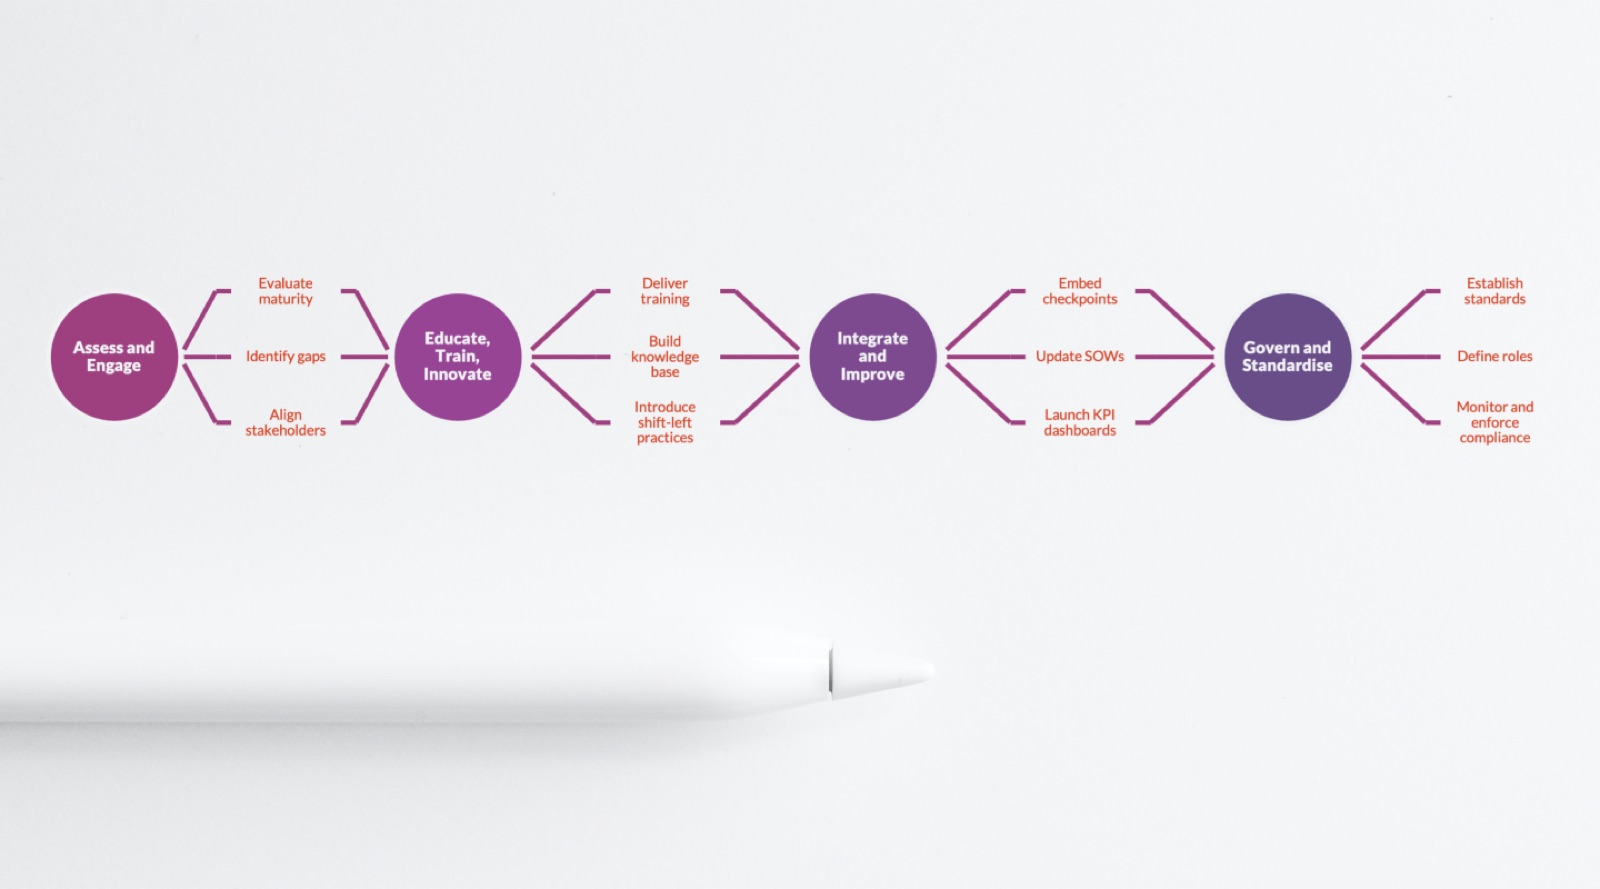
Vendor SOW requirements, WCAG expectations, VPAT reviews, approval gates, release checks, vendor management, training, and Power BI KPI dashboards embedded accessibility into normal delivery.
METHODS
Vendor SOWs · WCAG 2.2 · VPAT review · Approval gates · Power BI KPIs
04 · ITERATE
Teams gained ongoing control
Standards, dashboards, training, centralized guidance, defined ownership, and governance gave teams the tools to maintain the program as products and regulations changed.
CAPABILITY LEFT BEHIND
Governance model · Knowledge base · KPI dashboards · Standards · Training · Defined ownership · Vendor requirements
What changed
- 18%
- FEWER ACCESSIBILITY DEFECTS
- 6 MO
- TO MEASURABLE DEFECT REDUCTION
- 1
- SCALABLE GLOBAL GOVERNANCE MODEL
Business pattern
Recurring accessibility failures usually indicate a delivery-system problem, not an awareness problem.
INSURANCE · DESIGNOPS
Unifying 70+ digital properties.
Initial state
More than 70 disconnected websites and applications created fragmented customer journeys and inefficient internal delivery. Creative, business, and development teams duplicated work, missed deadlines, and operated under constant delivery pressure. A planned platform migration would have moved the same operating problems to new technology.
Capabilities applied
- Enterprise UX strategy
- DesignOps
- Service blueprinting
- Stakeholder workshops
- Design systems
- Figma
- Miro
- Information architecture
- Governance
- Organizational change
Initial assumption
Migrate 70+ properties.
→ Evidence
Broken workflows and handoffs drove cost and delay.
→ Reframed problem
Fix delivery before migration.
01 · ASSESS
Service blueprint exposed rework
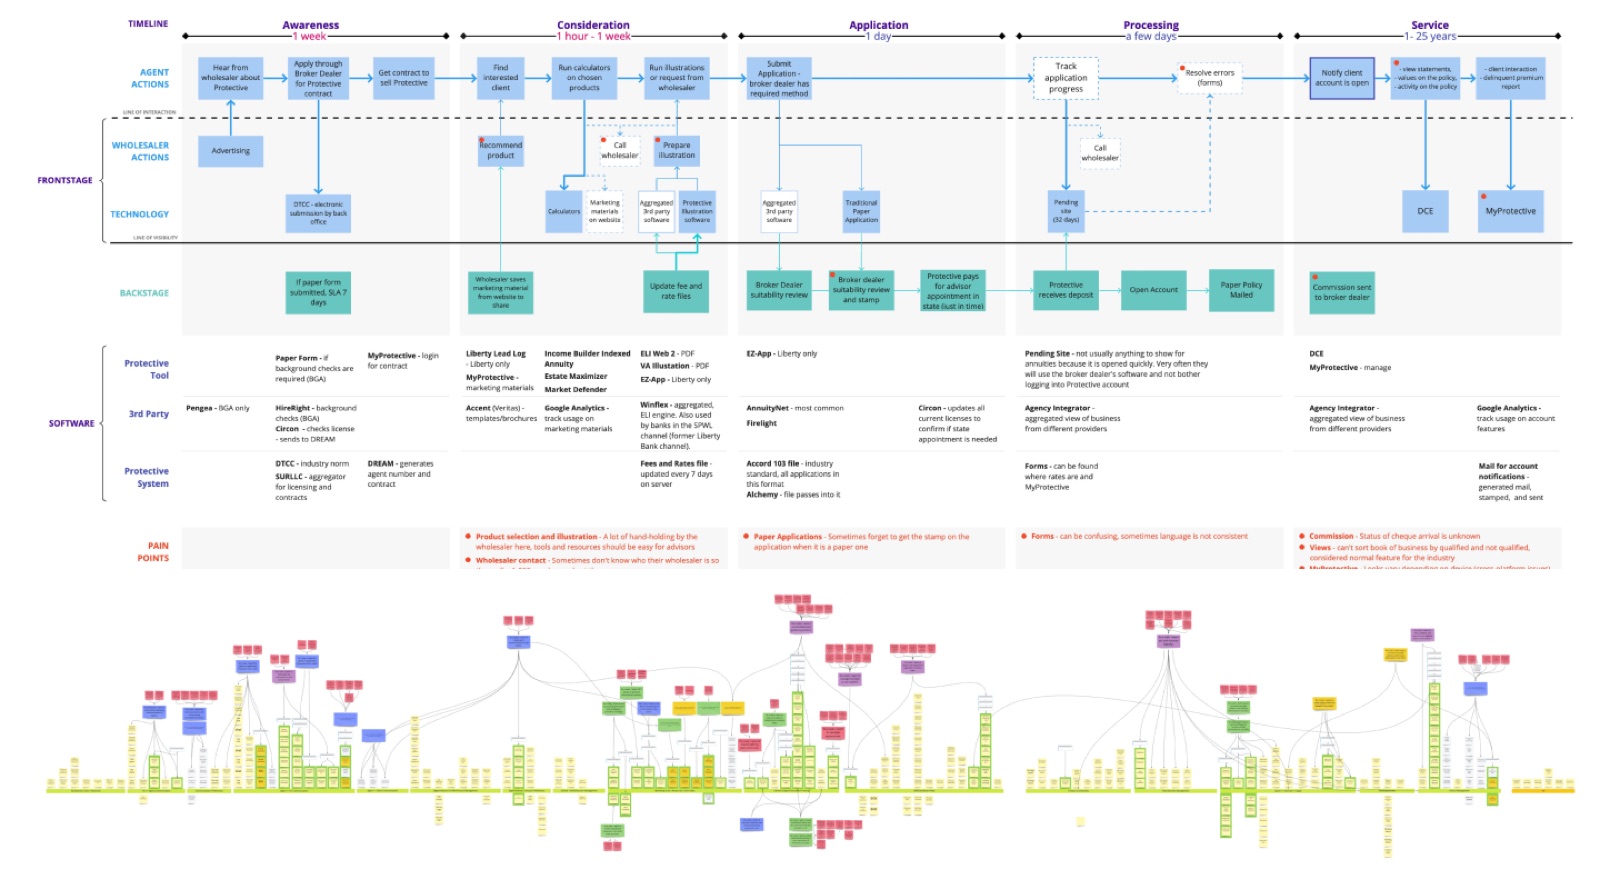
Workshops, service blueprinting, and dependency mapping showed how work moved across business units, Marketing, Creative, Design, and Technology. Duplicated effort, broken handoffs, and dependencies became visible.
METHODS
Stakeholder workshops · Service blueprint · Dependency mapping · Workflow analysis · Employee experience research
02 · ALIGN
Employee experience came first
The project shifted from platform migration to operating-model transformation. Governance groups, co-creation, and stakeholder alignment established one UX direction across business units.
METHODS
Co-creation · Executive alignment · Governance workshops · UX strategy · Change management
03 · IMPLEMENT
Delivery became a shared system
Figma and Miro modernization, centralized design capability, reusable patterns, information architecture, content workflows, governance, self-service publishing, and phased migration created one delivery system.
METHODS
Design system · Information architecture · Content workflows · Self-service publishing · Phased migration
04 · ITERATE
Internal teams took ownership
Governance, contribution rules, internal design capability, reusable patterns, and shared workflows allowed the organization to evolve the ecosystem without permanent consulting dependency.
CAPABILITY LEFT BEHIND
In-house design capability · Design system · Governance · Contribution model · Self-service patterns · Shared workflows
What changed
- 20%
- LOWER DEPARTMENTAL COST
- 60%
- LESS DEVELOPER DEPENDENCY
- 70+
- PROPERTIES IN ONE UNIFIED ECOSYSTEM
Business pattern
Technology modernization fails when the operating model that created the problem remains unchanged.
Let’s talk.
Tell me what you’re building, changing, or trying to make better. You don’t need a polished brief.
Prefer email? [email protected]
Project inquiry
Thank you — your message is on its way.
I read every inquiry personally and usually reply within one business day.